Macroeconomics Examination Questions
1. A first look at Macroeconomics
2. Real GDP—real gross domestic product
3. GDP and the Circular Flow of Expenditure and Income
The circular flow illustrates the equality of income, expenditure, and the value of production. The circular flow diagram shows the transactions among four economic agents—households, firms, governments, and the rest of the world—in two aggregate markets—goods markets and factor markets.
In the goods market, households, firms, governments, and foreigners buy goods and services. For analytical purposes, we can categorize spending by these four agents in the calculation of GDP:
· The total payment for goods and services by households in the goods markets is consumption expenditure, C.
· The purchases of new plants, equipment, and buildings and the additions to inventories are investment, I.
· Governments buy goods and services, called government expenditure or G, from firms.
· Firms sell goods and services to the rest of the world, exports or X, and buy goods and services from the rest of the world, imports or M. Exports minus imports are called net exports, X - M.
In factor markets households receive income from selling the services of resources to firms. The total income received is aggregate income. It includes wages paid to workers, interest for the use of capital, rent for the use of land and natural resources, and profits paid to entrepreneurs; retained profits can be viewed as part of household income, lent back to firms.
GDP Equals Expenditure Equals Income
Aggregate expenditure equals C + I + G + (X - M). Aggregate expenditure equals GDP because all the goods and services that are produced are sold to households, firms, governments, or foreigners. (Goods and services not sold are included in investment as inventories and hence are “sold” to the producing firm.)
· Because firms pay out as income everything they receive as revenue from selling goods and services, aggregate income equals aggregate expenditure equals GDP.
The “Gross” in gross domestic product reflects the fact that the investment in GDP is gross investment and so part of it goes to replace depreciating capital. Net domestic product subtracts depreciation from GDP.
4. The Expenditure Approach
5. The Income Approach
The income approach measures GDP as the sum of compensation of employees, net interest, rental income, corporate profits, and proprietors’ income. This sum equals net domestic income at factor costs. To obtain GDP, indirect taxes (which are taxes paid by consumers when they buy goods and services) minus subsidies plus depreciation are included. Finally any discrepancy between the expenditure approach and income approach is included in the income approach as “statistical discrepancy.”
6. Nominal GDP and real GDP
The market value of production and hence GDP can increase either because the production of goods and services are higher or because the prices of goods and services are higher.
Real GDP allows the quantities of production to be compared across time. Real GDP is the value of final goods and services produced in a given year when valued at the prices of a reference base year.
Nominal GDP is the value of the final goods and services produced in a given year valued at the prices that prevailed in that same year.
Calculating Real GDP
Traditionally, real GDP is calculated using prices of the reference base year (the year in which real GDP=nominal GDP).
7. The Uses and Limitations of Real GDP
One measure of the standard of living over time is real GDP per person, or real GDP divided by the population. Real GDP per person tells us the value of goods and services that the average person can enjoy. The value of real GDP when all the economy’s labor, capital, land, and entrepreneurial ability are fully employed is called potential GDP. Potential GDP grows at a steady pace because the quantities of the factors of production and their productivity grow at a steady pace.
Fluctuations in the pace of expansion of real GDP is denoted the business cycle, periodic but irregular increases and decreases in the total production and other measures of economic activity. Each cycle is categorized by: trough, expansion, peak, recession. Real GDP can be used to compare living standards across countries. But two problems arise in using real GDP to compare living standards:
First, the real GDP of one country must be converted into the same currency unit as the real GDP of the other country.
Second, the goods and services in both countries must be valued at the same prices. Relative prices in countries will differ, so goods and services should be weighted accordingly. For example, if more prices are lower in China than in the United States, China’s prices put a lower value on China’s production than would U.S. prices. If all the goods and services produced in China are valued using U.S. prices, than a more valid comparison can be made of real GDP in the two countries. This comparison using the same prices is called purchasing power parity (PPP) prices.
Limitations of Real GDP
Some of the factors that influence the standard of living are not part of real GDP. Omitted from GDP are:
Household Production: As more services, such as childcare, are provided in the marketplace, the measured growth rate overstates development of all economic activity.
Underground Economic Activity: If the underground economy is a reasonably stable proportion of all economic activity, though the level of GDP will be too low, the growth rate will be accurate.
Health and Life Expectancy: Better health and long life are not directly included in real GDP.
Leisure Time: Increases in leisure time lower the economic growth rate, but we value our leisure time and we are better off with it.
Environmental Quality: Pollution does not directly lower the economic growth rate.
Political Freedom and Social Justice: Political freedom and social justice are not measured by real GDP.
Economic Growth
Economic growth leads to large changes in standards of living from one generation to the next.
Economic growth rates vary across countries and across time.
There are different economic theories to explain these variations in growth rates.
I. The Basics of Economic Growth
The economic growth rate is the annual percentage change of real GDP. This growth rate is equal to:
Real GDP growth rate = 
The standard of living depends on real GDP per person, which is real GDP divided by the population. The growth rate of real GDP per person can be calculated using the formula above, though substituting real GDP per person.
The growth rate of real GDP per person also approximately equals the growth rate of real GDP minus the population growth rate.
8. Economic Growth Trends
9. How Potential GDP Grows
Potential GDP is the amount of real GDP that is produced when the quantity of labor employed is the full-employment amount. To determine potential GDP we use the aggregate production function and the aggregate labor market. 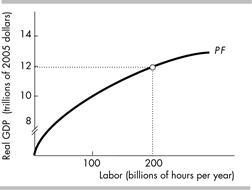
The aggregate production function is the relationship between real GDP and the quantity of labor employed when all other influences on production remain the same. The figure shows an aggregate production function.
The additional real GDP produced by an additional hour of labor when all other influences on production remain the same is subject to the law of diminishing returns, which states that as the quantity of labor increases, other things remaining the same, the additional output produced by the labor decreases. The production function in the figure shows the law of diminishing returns because its shape demonstrates that as additional labor is employed, the additional GDP produced diminishes.
10. The Labor Market
The demand for labor is the relationship between the quantity of labor demanded and the real wage rate.
The real wage rate equals the money wage rate divided by the price level. The real wage rate is the quantity of goods and services that an hour of labor earns and the money wage rate is the number of dollars that an hour of labor earns.
Because of diminishing returns, firms hire more labor only if the real wage falls to reflect the fall in the additional output the labor produces. There is a negative relationship between the real wage rate and the quantity of labor demanded so, as illustrated in the figure, the demand for labor curve is downward sloping. 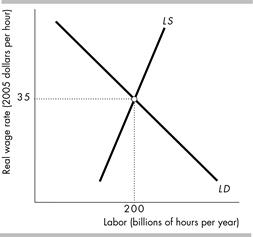
The supply of labor is the relationship between the quantity of labor supplied and the real wage rate.
An increase in the real wage rate influences people to work more hours and also increases labor force participation. These factors mean there is a positive relationship between the real wage rate and the quantity of labor supplied so, as illustrated in the figure, the supply of labor curve is upward sloping.
In the labor market, the real wage rate adjusts to equate the quantity of labor supplied to the quantity of labor demanded. In equilibrium, the labor market is at full employment. In the figure, the equilibrium quantity of employment is 200 billions of hours per year.
Potential GDP is the level of production produced by the full employment quantity of labor. In combination with the production function shown in the previous figure, the labor market equilibrium in the figure of 200 billion hours per year means that potential GDP is $12 trillion.
11.  What Makes Potential GDP Grow?
Potential GDP grows when the supply of labor grows and when labor productivity grows.
The supply of labor increases if average hours per worker increases, if the employment-to-population ratio increases, or if the working-age population increases. Only increases in the working-age population can cause persisting economic growth. Persisting increases in the working-age population result from population growth.
 An increase in population increases the supply of labor, which shifts the labor supply curve rightward. The real wage rate falls and the quantity of employment increases. The increase in employment leads to a movement along the production function to a higher level of potential GDP.
An increase in labor productivity increases the demand for labor and shifts the production function upward.
As the top figure illustrates, the increase in the demand for labor from LD0 to LD1 raises the real wage rate. The bottom figure shows that the production function has shifted upward, from PF0 to PF1. An increase in labor productivity leads to an increase in real GDP per person and increases the standard of living.
12. Why Labor Productivity Grows
Preconditions for Labor Productivity Growth
The institutions of markets, property rights, and monetary exchange create incentives for people to engage in activities that create economic growth and are preconditions for growth in labor productivity. Market prices send signals to buyers and sellers that create incentives to increase or decrease the quantities demanded and supplied. Property rights create incentives save and invest in new capital and develop new technologies. Monetary exchange creates incentives for people to specialize and trade.
Persistent growth requires that people face incentives to create:
Physical Capital Growth: Saving and investing in new capital expands production possibilities.
Human Capital Growth: Investing in human capital speeds growth because human capital is a fundamental source of increased productivity and technological advance.
Technological Advances: Technological change, the discovery and the application of new technologies and new goods, has made the largest contribution to economic growth.
13. Growth Theories
Classical growth theory is the view that real GDP growth is temporary and that when real GDP per person rises above the subsistence level, a population explosion eventually brings real GDP per person back to the subsistence level.
A problem with the classical theory is that population growth is independent of economic growth rate.
Neoclassical growth theory is the proposition that the real GDP per person grows because technological change induces a level of saving and investment that makes capital per hour of labor grow.
A technological advance increases productivity. Real GDP per person increases.
The technological advances increase expected profit. Investment and saving increase so that capital increases. The increase in capital raises real GDP per person.
As more capital is accumulated, eventually projects with lower rates of return must be undertaken so that the incentive to invest and saving decrease. Eventually capital stops increasing so that economic growth stops.
The improvement in technology permanently increases real GDP per person.
A problem with the neoclassical theory is that it predicts that real GDP per person in different nations will converge to the same level. But in reality, convergence does not seem to be taking place for all nations.
New growth theory holds that real GDP per person grows because of the choices people make in the pursuit of profit and that growth can persist indefinitely.
The theory emphasizes that discoveries result from choices, discoveries bring profit, and competition then destroys the profit. It also stresses that knowledge can be used by everyone at no cost and knowledge is not subject to diminishing returns.
The ability to innovate means new technologies are developed and capital accumulated as in the neoclassical model. The production function shifts upward. Real GDP per person increases.
The pursuit of profit means that more technological advances occur and the production function continues to shift upward. Nothing stops the upward shifts of the production function because the lure of profit is always present.
The ability to innovate determines how capital accumulation feeds into technological change and the resulting growth path for the economy. Productivity and real GDP constantly grow.
14. Employment and Unemployment
The working-age population is the total number of people aged 16 years and over who are not in jail, a hospital, or some other form of institutional care. The labor force is the sum of the employed and the unemployed.
Unemployment occurs when someone who wants a job cannot find one. To be counted as unemployed, a person must be available for work and must be in one of three categories:
Without work but has made specific efforts to find a job within the previous four weeks
Waiting to be called back to a job from which he or she has been laid off
Waiting to start a new job within 30 days.
Unemployment is a state in which a person does not have a job but is available for work, willing to work, and has made some effort to find work within the previous four weeks.
The labour force is the total number of people who are employed and unemployed.
The unemployment rate is the percentage of the people in the labour force who are unemployed.
A discouraged worker is a person who available for work, willing to work, but who has given up the effort to find work.
Why Unemployment Is a Problem
Unemployment is a serious economic, social, and personal problem for two main reasons:
Lost production and incomes
Lost human capital
The loss of a job brings an immediate loss of income and production—a temporary problem.
A prolonged spell of unemployment can bring permanent damage through the loss of human capital.
15. Three Labor Market Indicators
The unemployment rate is the percentage of the people in the labor force who are unemployed. It equals  and Labor force = Number of people employed + Number of people unemployed.
The employment-to-population ratio is the percentage of people of working age who have jobs. It equals 
The labor force participation rate is the percentage of working-age population who are members of the labor force. It equals 
Marginally attached workers are people who are available and willing to work but currently are neither working nor looking for work. These workers often temporarily leave the labor force during a recession and decrease the labor force participation rate. Because they are no longer counted as unemployed, marginally attached workers lower the unemployment rate. Adiscouraged worker is a marginally attached worker who has stopped looking for work because of repeated failures to find a job.
16. Types of Unemployment
Frictional unemployment is the unemployment that arises from normal labor turnover. These workers are searching for jobs. The unemployment related to this search process is a permanent phenomenon in a dynamic, growing economy. Frictional unemployment increases when more people enter the labor market or when unemployment compensation payments increase.
Structural unemployment is the unemployment that arises when changes in technology or international competition change the skills needed to perform jobs or change the locations of jobs. Sometimes there is a mismatch between skills demanded by firms and skills provided by workers, especially when there are great technological changes in an industry. Structural unemployment generally lasts longer than frictional unemployment. Minimum wages and efficiency wages create structural unemployment.
Cyclical unemployment is the fluctuating unemployment over the business cycle. Cyclical unemployment increases during a recession and decreases during an expansion.
“Natural” Unemployment
Natural unemployment is the unemployment that arises from frictions and structural change when there is no cyclical unemployment—when all the unemployment is frictional and structural. Natural unemployment as a percentage of the labor force is called the natural unemployment rate.
Full employment is defined as a situation in which the unemployment rate equals the natural unemployment rate.
17. What Determines the Natural Unemployment Rate?
The Age Distribution of the Population
An economy with a young population has a large number of new job seekers every year and has a high level of frictional unemployment.
The Scale of Structural Change
The scale of structural change is sometimes small but sometimes there is a technological upheaval. When the pace and volume of technological change and when the change driven by international competition increase, natural unemployment rises.
The Real Wage Rate
The natural unemployment rate increases if minimum wage is raised to exceed the equilibrium wage rate or if more firms use an efficiency wage (a wage set above the equilibrium real wage to enable the firm to attract the most productive workers and motivate them to work hard and discourage them from quitting).
Unemployment Benefits
Unemployment benefits increase the natural unemployment rate by lowering the opportunity cost of job search.
Real GDP and Unemployment Over the Business Cycle
When the economy is at full employment, the unemployment rate equals the natural unemployment rate and real GDP equals potential GDP. When the unemployment rate is greater than the natural unemployment rate, real GDP is less than potential GDP. And when the unemployment rate is less than the natural unemployment rate, real GDP is greater than potential GDP. The gap between real GDP and potential GDP is called the output gap.
18. The Price Level, Inflation, and Deflation
The price level is the average level of prices. The average level of prices can be rising, falling, or stable.
Inflation is a process of rising prices.
We measure the inflation rate as the percentage change in the average level of prices or the price level.
Inflation occurs when the price level persistently rises; deflation occurs when the price level persistently falls. The inflation rate is the percentage change in the price level.
Why Inflation and Deflation are Problems
Unexpected inflation or deflation is a problem for society because they redistribute income and wealth. Unexpected inflation benefits workers and borrowers; unexpected deflation benefits employers and lenders. They motivate people to divert resources from producing goods and services to forecasting and protecting themselves from the inflation or deflation.
Unexpected deflation hurts businesses and households that are in debt (borrowers) who in turn cut their spending. A fall in total spending brings a recession and rising unemployment.
Hyperinflation is an inflation rate of 50 percent a month or higher
19. The Consumer Price Index
A consumer price index (CPI) measures changes in the price level of a market basket of consumer goods and services purchased by households.
The CPI is a statistical estimate constructed using the prices of a sample of representative items whose prices are collected periodically. Sub-indexes and sub-sub-indexes are computed for different categories and sub-categories of goods and services, being combined to produce the overall index with weights reflecting their shares in the total of the consumer expenditures covered by the index. It is one of several price indices calculated by most national statistical agencies. The annual percentage change in a CPI is used as a measure of inflation. A CPI can be used to index (i.e., adjust for the effect of inflation) the real value of wages, salaries, pensions, for regulating prices and for deflating monetary magnitudes to show changes in real values. In most countries, the CPI is, along with the population census and the USA National Income and Product Accounts, one of the most closely watched national economic statistics.
The Consumer Price Index (CPI) is a measure of the average of the prices paid by urban consumer for a fixed “basket” of consumer goods and services. The CPI is defined to equal 100 for a period called the reference base period.
The CPI has four biases that lead it to overstate the inflation rate. The biases are:
New Goods Bias: New goods are often more expensive than the goods they replace.
Quality Change Bias: Sometimes price increases reflect quality improvements (safer cars, improved health care) and should not be counted as part of inflation.
Commodity Substitution Bias: Consumers substitute away from goods and services with large relative price increases.
Outlet Substitution Bias: When prices rise, people use discount stores more frequently and convenience stores less frequently.