State Transition diagram in UML
The techniques of extracting nouns and creating an object diagram are both elements of data modeling, which is concerned with identifying all of the data objects that need to be designed for a piece of software. The analysis process also involves dynamic modeling, which identifies all of the states, events, and corresponding actions to be taken by the software. This information is represented in the form of a state transition diagram [14].
Unified Modeling Language (UML) contains a special notation for state transition diagrams. This notation includes the following elements:
States: Individual states are represented as rounded rectangles. Each rectangle has two partitions, one containing the state name (label), and the other containing a set of actions to be taken by the software when the state is entered. The set of actions associated with a state may be empty, in which case only the state name (label) appears inside the rounded rectangle [17].
Transitions: A transition from one state to another is represented as a line with an arrow, drawn from the prior state to the subsequent state. The transition is labeled with a set of predicates that determines when the transition should take place. All of the predicates must be true for the transition to take place. The predicates are drawn as a set of short phrases in square brackets. If a transition from one state to another occurs as soon as the prior state's actions are complete, then there are no predicates controlling the transition and the transition will be drawn as a directed line with no labeling [18].
Start state: The initial start state is represented as a solid (black) circle, with an unlabeled transition to the first state in the state diagram [15] as shown in the below Figure 2.3.
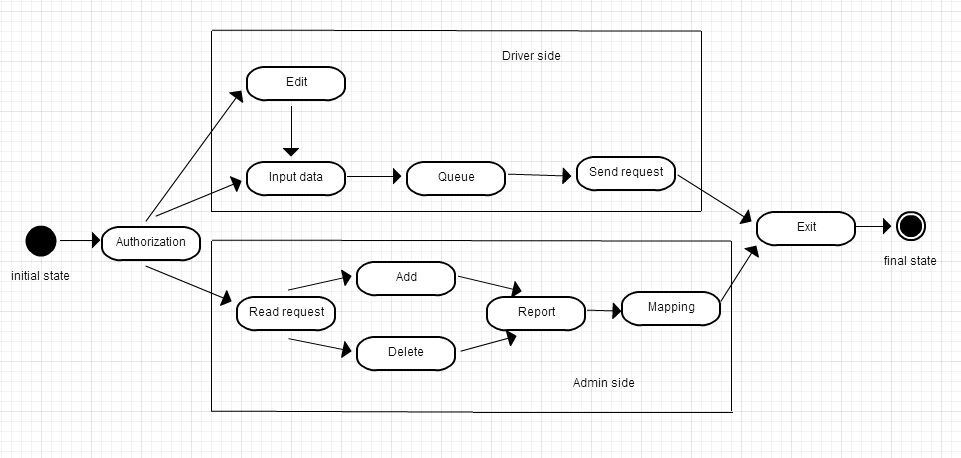
Figure 2.3- State transition diagram of transport system
2.2 Information system platform
To show the simulation of my diploma project I choose 3D MAX. The Datamat 3ds Max 2016 Modeling class provides a thorough introduction to the visualization capabilities within the 3ds Max 2016 software. It is intended for organizations that perform all modeling within 3ds Max Design and have only limited interest in linking or importing geometry from other 3D design software.
The practices in this course are geared towards real-world tasks encountered by the primary users of Autodesk 3ds Max Design: professionals in the Architecture, Interior Design, Civil Engineering, and Mechanical Engineering industries. Also 3ds Max works with most major renderers, such as V-Ray, Iray, and mental ray, to create high-end scenes and striking visuals for design visualization and more. 3ds Max is used by top-tier animation and design firms to create imaginative characters and realistic scenes in games and architecture [16].
2.2.1 System description and manual
After opening the system, there will be opening the main page of the system (Figure 2.4). This page shows options like: any state, entry, new state, exit, take 001.
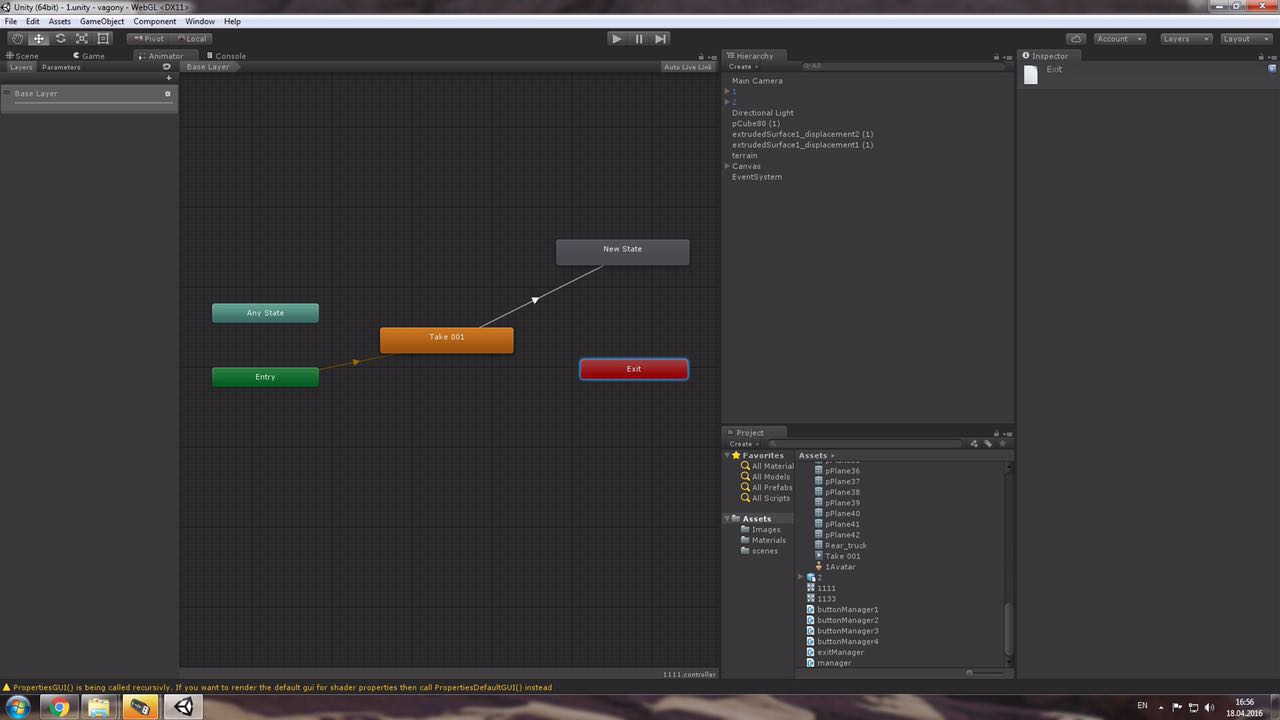
Figure 2.4 – The main page
The second page shows “Select texture” option as shown in the Figure 2.5
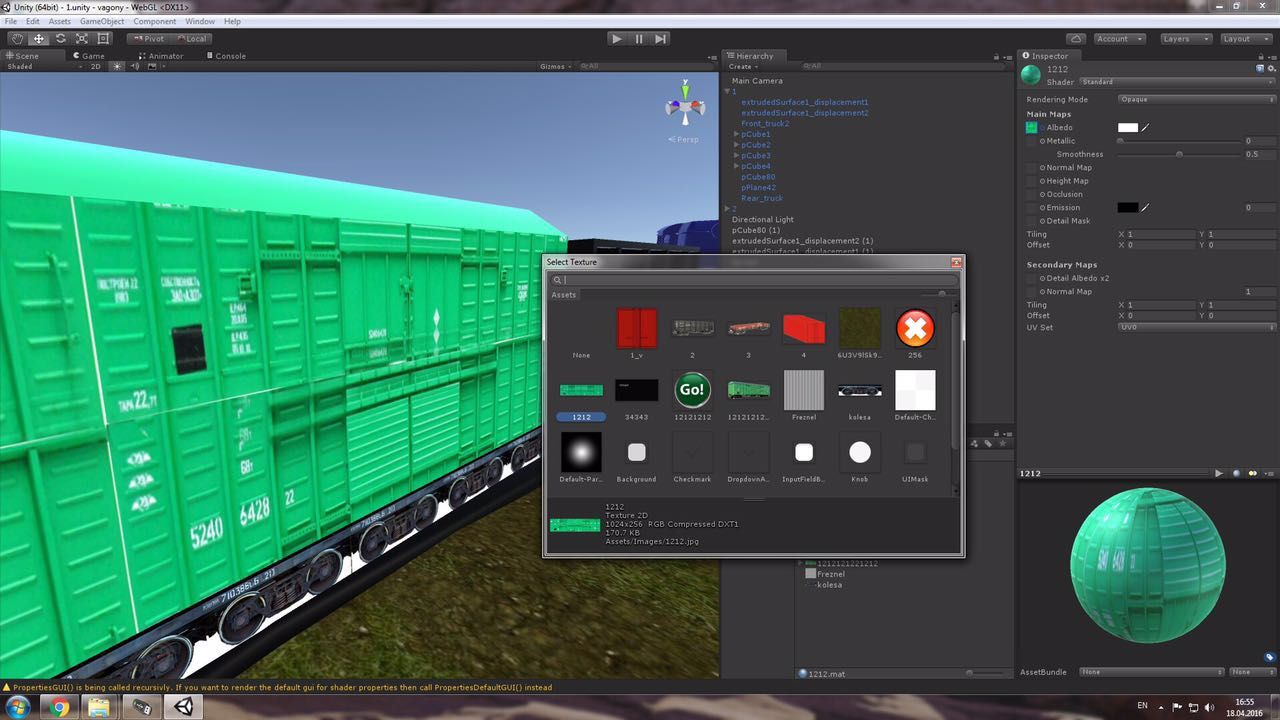
Figure 2.5 – Select texture page
After that the system gives the detailed information about transport. (Figure 2.6 and Figure 2.7)
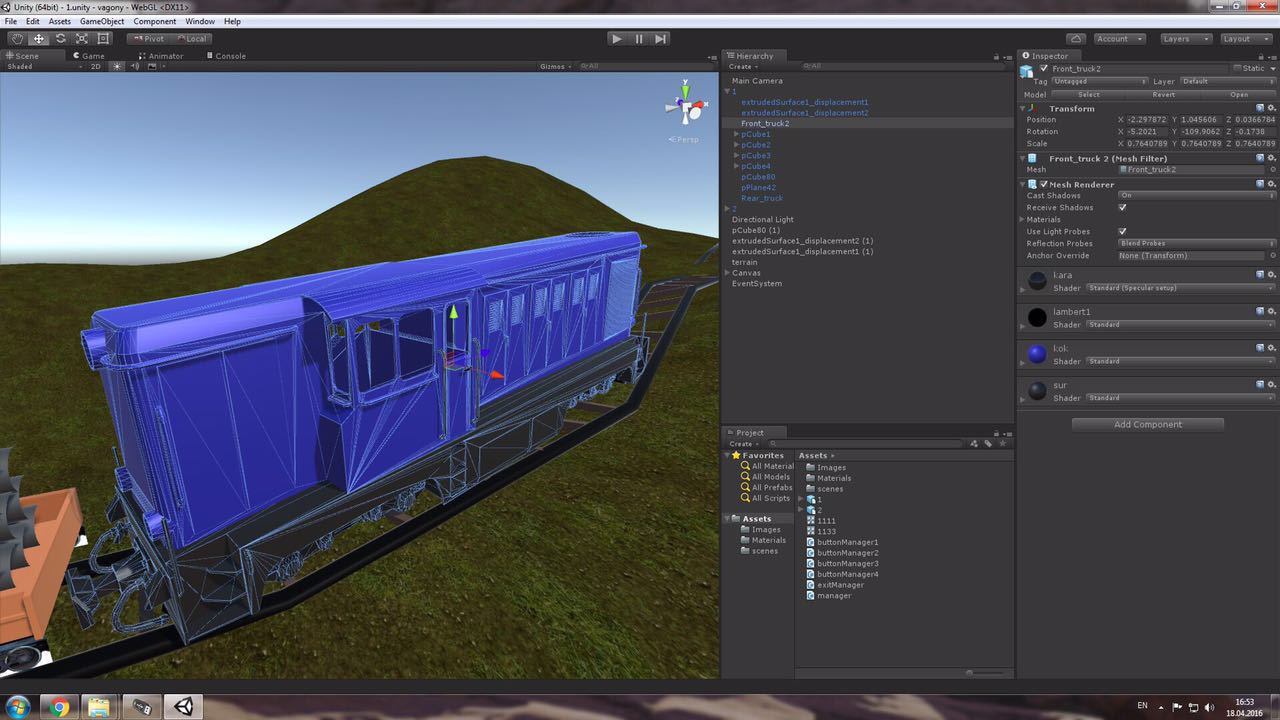
Figure 2.6 – transport information page

Figure 2.7 – Transport information page
There is also given a list of options on the main page as shown in the Figure 2.8.

Figure 2.8 – The options page
By choosing the desired image we can copy it as shown in the Figure 2.9.

Figure 2.9 – The transport page
A page presented below shows the 3D view of freight system (Figure 2.10 and Figure 2.11).

Figure 2.10 – The 3D view

Figure 2.11 - The 3D view
Figures given below (Figure 2.12 and Figure 2.13) shows how the animation and the animation tools work.

Figure 2.12 – The animation page

Figure 2.13 – The animation page
3 JUSTIFICATION OF ECONOMIC EFFICIENCY OF THE PROJECT
Economic efficiency of the project presents information about economic justification of the project, including analysis and economic calculations. Economic efficiency is the use of resources to maximize the production of goods and services. For this, we should always correlate benefits and the costs, in other words, we should be rational. Rational behavior means that the producer and consumer goods strive for the highest efficiency and for this reason maximize the benefits and minimize costs.
3.1 Selection and justification of the methods of calculating cost-effectiveness
The main objective of the project is to develop a secure freight train routing system. Evaluation of economic efficiency of an IT project is an essential part of its feasibility study. Introduction of the IT system affects the final financial and economic performance of the organization directly using the technology. IT provides the management staff with new technologies instead of improving the market position of organization. The efficiency of their use depends on how good is the possibility of IT technology to for the business opportunities of the organization.
The effectiveness of introduction of automated information system is caused by the influence of factors of various informational, economic and organizational characters.
The informational efficiency factor is expressed in raising awareness of staff i.e. fast access to the information resources. The economic factor is manifested in the fact that accounting information having full and timely reflection and the state of the object and the factors influencing its development ultimately aims to improve the utilization of productive resources.
The organizing effect is manifested in the release of employees from routine operations to organize and group credentials, numerous calculations and entries in the registers and other documentation, verification performance, thereby increasing the time to analyze and evaluate the effectiveness of management decisions or something like that.
Experience with automating complex tasks showed that in the process of automation of activities there is achieved reduction in complexity of individual operations, increased productivity and improvement of the working conditions of individual workers, increased efficiency of decision-making, the reliability of output information, including the preparation of reports for the ever-growing volume of source documents without increasing staff. Economic efficiency is composed of two main components:
Ø improving financial performance
Ø time savings on some transactions
The basis for the evaluation of economic efficiency can serve as the time spent on one activity. Introduction of the system can provide significant effect by reducing the time for reporting, which is directly connected with the entire process of analysis of the data. Also, can be expected from the introduction reducing the time to write queries and reports, improving the quality of work during the examination of data reduction and document the transition to paperless processing of information, culture and increase productivity. Automation of complex tasks is to change the quality features, these include:
Ø the frequency of error decisions because of the use of false information increases the probability of making a wrong decision which affects the final result of the activity
Ø speed of detection of errors in the decisions made significantly reduce the likelihood of errors
Ø the average time to find a solution: the system will shorten the decision-making process
The main factors that determine the cumulative effect of automation:
Ø reducing the complexity of data processing by switching to paperless technologies
Ø quality improvement process from the stage of acceptance of documents to the stage of registration of report
Ø reduce dependence on specific individuals who are holders of information because the use of paper-based data does not allow simultaneous use of a single resource to multiple employees but the introduction of such system easily allow
Methods for evaluating the effectiveness of the project suggest the need to evaluate income and expenditure part of the project. Evaluation expenditure part involves identifying the following groups of expenditures:
Ø expenses on salary payment for the personnel (programmer);
Ø expenses associated with website development and software implementation;
Ø web site implementation and promotion